This will be a quick explanation of how we made the state policy maps in our recent paper, “Associations between State Laws Governing Recess Policy with Children’s Physical Activity and Health.”
Our Purpose
In this paper, we were looking at the association between state law regarding school recess and children’s physical activity and other outcomes. We used data from the Classification of Laws Associated with School Students (CLASS) which is available online. CLASS has yearly, state-by-state information about laws governing physical education, physical activity, and nutrition in schools.
Making State Maps in R
You can download this data to your computer and read it in to R.
class<-xlsx::read.xlsx("Physical_Education_Enhanced_Data_File_2018.xlsx",sheetIndex = 1)
Or, you can import it straight from the webpage using the rio package
class<-rio::import("https://class.cancer.gov/Content/data/Physical_Education_Enhanced_Data_File_2003-2019.xlsx")
We don’t need all those variables, so I’ll just subset the ones of interest. I’ll also rename them because the package used to make maps requires a variable named “state.”
  class<-dplyr::select(class,c("STATE","YEAR","RECESS"))
  names(class)<-c("state","year","recess")
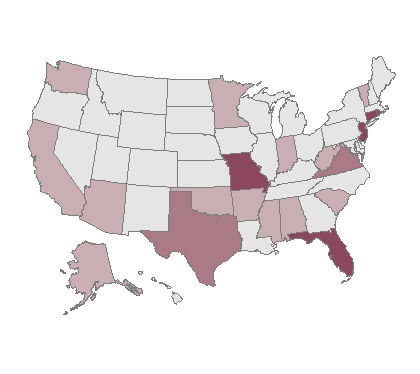
Now we will use the usmap package (and ggplot2) to make some magic happen.
  library(ggplot2)
  usmap::plot_usmap(data = subset(class,year=="2018"), values = "recess",  color = "grey49", labels=FALSE,show.legend=FALSE) +
    scale_fill_continuous( low = "grey90", high = "palevioletred4", label = scales::comma) + theme(panel.background = element_rect(colour = "white"))
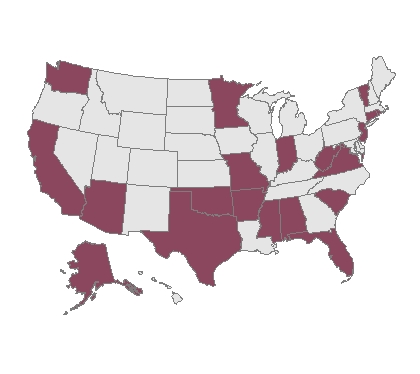
In the paper, we recoded recess law to a dichotomous value and plotted that instead.
  class$recess[class$recess==2|class$recess==3|class$recess==4]<-1
  usmap::plot_usmap(data = subset(class,year=="2018"), values = "recess",  color = "grey49", labels=FALSE,show.legend=FALSE) +
    scale_fill_continuous( low = "grey90", high = "palevioletred4", label = scales::comma) + theme(panel.background = element_rect(colour = "white"))